IPHC Space-time Explorer
Explore the output from the IPHC's space-time modelling of Pacific halibut weight and numbers per unit effort (WPUE and NPUE)
- View maps showing the estimated spatial distribution of WPUE and NPUE since 1993.
- Select a subset of survey stations to compute time series estimates for any region of interest; download graphs and tables for your selected region.
- Review and download official modelling results for IPHC Regulatory Areas and combinations of IPHC Regulatory Areas.
Reference
Webster R. A., Soderlund E., Dykstra C. L., and Stewart I. J. (2020). Monitoring change in a dynamic environment: spatio-temporal modelling of calibrated data from different types of fisheries surveys of Pacific halibut. Can. J. Fish. Aquat. Sci. 77(8): 1421-1432.
https://doi.org/10.1139/cjfas-2019-0240
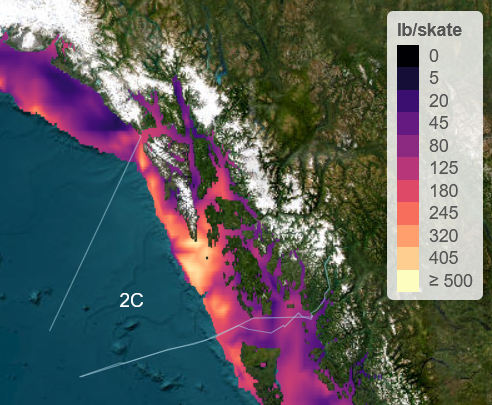
Spatial distribution map
Explore maps of space-time model output.
- Select the Spatial distribution map tab.
- Select a year to display using the slider in the movable selection box.
- Select a variable to explore using the drop-down menus.
- Colours represent space-time model predictions of selected variables at survey station locations:
- Most stations are on the IPHC FISS 10x10 nmi grid
- In the Bering Sea, prediction for depths under 75 ftm is on the NMFS 20x20 nmi trawl grid
- Off the north Washington coast, prediction is on the dense FISS grid used in 2017-18
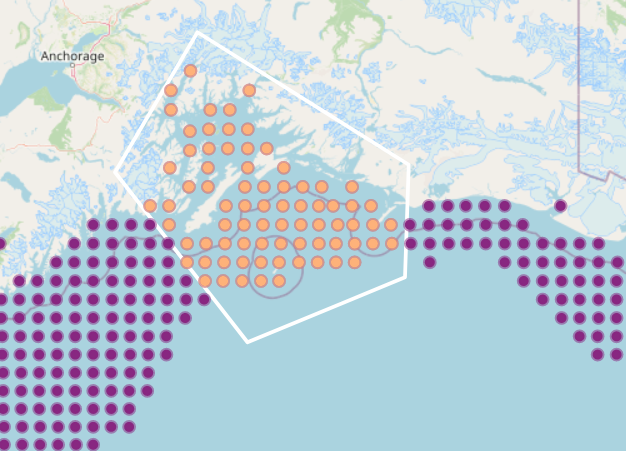
- Circle size is inversely proportional to station density, e.g., circles are larger in the Bering Sea, where station density is lower.
- CV = coefficient of variation (%), a measure of relative variability. Note that CVs can be very high for individual stations, particularly when means are close to zero (e.g., in the Bering Sea).
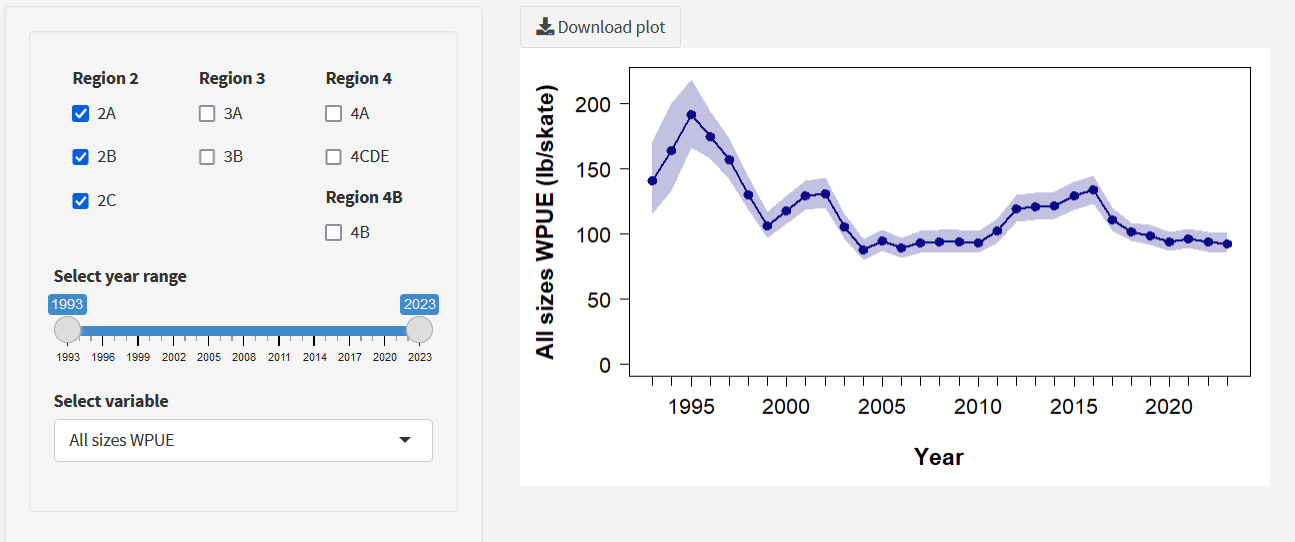
Time Series
Create and download plots and tables of mean Pacific halibut survey WPUE or NPUE for any region of interest
- Station selection tab:
- Select groups of survey stations to include in the time series using the selection polygons at upper left.
- Select entire IPHC Regulatory Areas, subsetted by depth and year range, using the tools in the movable selection box.
- Output will be displayed by selecting the Time series tab
- More than one station must be selected or an error will occur.
- Select O32 WPUE, all sizes WPUE, or all sizes NPUE.
- CV = coefficient of variation (%), a measure of relative variability. Its value will depend on the underlying variability of Pacific halibut density and the number of stations selected.
- Note: Depth range changes do not affect stations chosen with selection polygons
- Note: The default depth range of 0-400 fathoms includes several stations in the 0-10 fathom range, and for consistency, these are excluded from official results. The FISS does not target stations in 0-10 fathoms for logistical reasons, although these depths are still considered Pacific halibut habitat and included in geographic area calculations.
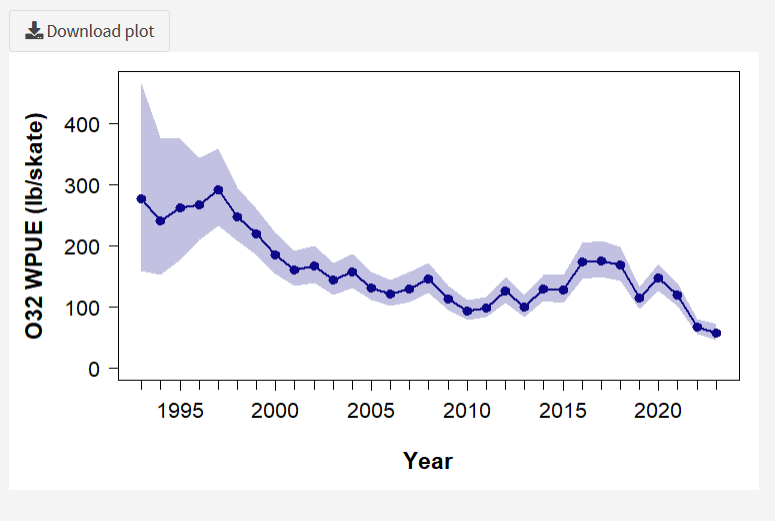
- Time series tab:
- Output for selected stations will appear as a plot and table in this tab.
- Shaded regions in the plot show 95% credible intervals, as a measure of variability/uncertainty.
- Processing time depends on the size of the selection.
- Estimates may differ slightly from official output for IPHC Regulatory Areas
- The official space-time results aggregate output across IPHC Regulatory Areas by weighting by geographic area from 0-400 fathoms.
- The Time series tab calculates averages across stations (weighted by station density): the ratio of station counts to geographic area varies slightly among IPHC Regulatory Areas.
- The IPHC setline survey does not target stations in depths of 0-10 fathoms, so differences also reflect differences among Regulatory Areas in the proportion of geographic area between 0 and 10 fathoms.
- Stations in the IPHC Regulatory Area 2B/2C overlap have two estimates based on separate modelling for each area. At present, these stations are counted twice when they are selected in the Station selection tab (which is not the case in official results). This will be corrected in future versions of the tool.
Official output
Create and download plots and tables of mean Pacific halibut survey WPUE or NPUE for any combination of IPHC Regulatory Areas
- Estimates may differ slightly from those calculated using the Time series tab.
- The official space-time results combine output across Regulatory Areas by weighting by geographic area from 0-400 fathoms.
- The Time series tab calculates averages across stations (weighted by station density): the ratio of station counts to geographic area varies slightly among IPHC Regulatory Areas.
- The IPHC setline survey does not target stations in depths of 0-10 fathoms, so differences also reflect differences among Regulatory Areas in the proportion of geographic area between 0 and 10 fathoms.